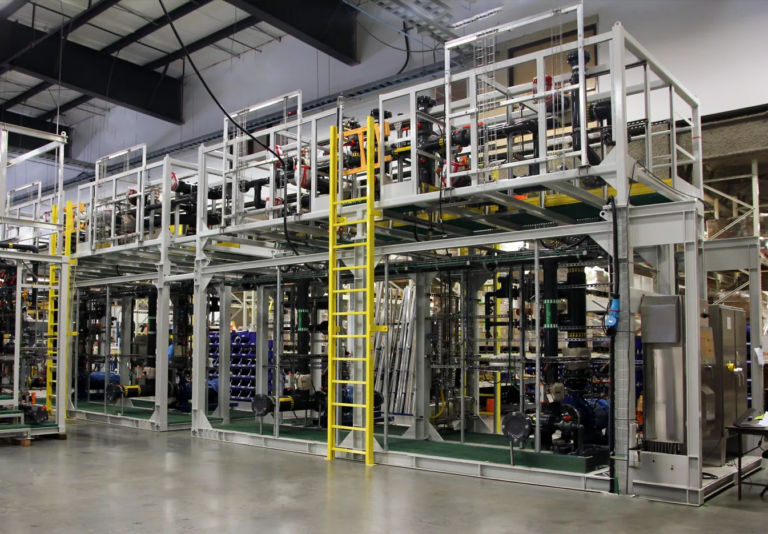
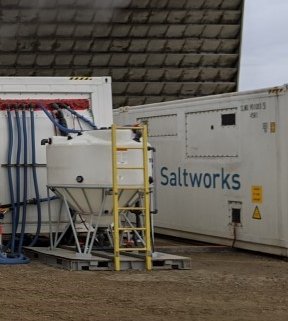
Achieving 70x Cooling Tower Blowdown Volume Reduction

Optimize treatment: know when to stop by using a pilot and recovery economics

Sep 13th 2019, Updated May 28th 2021

Key Takeaways

  • Recent reverse osmosis (RO) improvements enable extreme recoveries of up to 99% in the treatment of cooling tower blowdown (CTB) for minimal liquid discharge (MLD) or reducing the cost of zero liquid discharge (ZLD) systems.
  • Ultra-high-pressure (UHP) spiral wound membrane systems can achieve brine concentrations of 130,000 mg/L total dissolved solids (TDS)—near those of evaporators—as long as scaling and fouling are controlled.
  • Chemical treatment systems such as BrineRefine enable higher RO recoveries and reduce scaling/fouling, especially when paired with new real-time scaling ion sensors and robust ultrafiltration systems.
  • Each incremental treatment addition can improve volume reduction and recovery, but can increase costs and complexity.
  • Knowing your brine disposal costs allows you to determine where to stop in the treatment process.
A photo of cooling towers producing steam

Background

Cooling towers are used by industrial plants to eject waste heat to atmosphere. Evaporation of water removes heat and results in concentration of ions and metals in the cooling water that remains. A portion of the cooling water is blown down after a number of cycles, before the ions and metals reach their concentration scaling limits. This cooling tower blowdown (CTB) water requires management. Meanwhile, the water lost as blowdown or from evaporation or drift must be replaced with makeup water, typically from a freshwater source.


There are a number of ways to minimize blowdown generation and freshwater consumption by safely increasing the number of cooling tower cycles before the need for blowdown. The number of cycles before blowdown can be optimized using sensors and controls, or by targeting specific contaminants-of-concern such as chlorides or scaling ions.

Once the CTB is generated, options for managing cooling tower blowdown (CTB) consist of:
  • Directly discharging to nearby surface water or land, if regulations permit
  • Storage and volume reduction in an evaporation pond, if climate and regulatory conditions are favorable
  • Disposal via injection wells, if located near the site
  • Discharge to a local wastewater treatment facility, if operators agree to accept it
  • Treatment of CTB for discharge or reuse
This article focuses on the last option: CTB treatment.
Photo of cooling towers at a nuclear power plant

Important Cooling Tower Project Considerations

Before deciding how to manage CTB, key project information must be gathered first:

  1. Water chemistry, flow rate, and scaling potential: Our article on RO & Evaporator Scale Control discusses how scale forms, its implications for water treatment systems, and how to avoid scaling. Alternatively, contact Saltworks and we can help you.
  2. Required quality of treated water: Whether water is reused in the plant, reused elsewhere, or discharged, any water treatment system will need to meet the relevant water quality criteria.
  3. Brine management options: CTB consists of inorganic constituents; industrial desalination technology used to treat the water will generally produce a concentrated brine. Our article on how to manage brine disposal & treatment describes several options.

Considering these details and any other important plant information will allow a critical assessment of options and their economics.

CTB Treatment Economics

Once the CTB has been generated, treatment solutions vary from relatively minor, targeted interventions, to comprehensive full treatment trains that combine membrane and thermal systems to achieve minimal liquid discharge (MLD) or zero liquid discharge (ZLD).


Understanding the cost of alternate (non-treatment) CTB management options is important for properly comparing total treatment costs and what treatment options are possible within a given budget. To keep these total costs low, it is usually beneficial to achieve the highest RO recovery possible, thus minimizing more expensive volume reduction further downstream in evaporators or offsite transport for disposal.


It should be noted that seemingly small changes in recovery percentages have a large, non-intuitive impact on brine volume. For example, boosting recovery from 95% to 97.5% may seem like gaining “only 2.5%”. However, this means halving the volume of the remaining brine and therefore 50% fewer trucks needed for disposal (or 50% smaller evaporation pond capacity or a 50% smaller downstream evaporator). Savings from boosting recovery can be enormous, as demonstrated in the CTB treatment case study below.

Photo of a heavy wastewater truck in use for brine management

Pilot Case Study

A North American power plant was sending their CTB to evaporation ponds. However, the ponds were reaching capacity and offsite disposal was an expensive option. The power plant sought a treatment option to reduce offsite disposal volumes in order to lower costs. The treated water needed to meet utility water reuse requirements such that TDS < 500 mg/L. The water chemistry is summarized in Table 1.

Table 1: Power Plant Water Chemistry: Raw, and at Each Successive Recovery Increase

With a TDS of 1,750 mg/L, the raw CTB is suitable for treatment by reverse osmosis (RO). 80% recovery is achievable with a conventional, primary RO system, reducing CTB volume by 5x. After the primary RO, the volume can be further reduced and recovery increased using other technologies, including ultra-high pressure reverse osmosis. A flexible pilot system with multiple process configurations to analyze performance and cost at incrementally increasing recoveries was tested on the CTB.


Figure 1 shows a simplified process flow diagram of the pilot system. The incremental process steps and their costs are explored below for volume reductions (and recoveries) of 10x (90%), 20x (95%), 40x (97.5%), and 70x (99%). Brine concentration and composition changes with each incremental step in recovery improvement are shown in Table 1. Table 2 shows the recovery at each stage, the volume reduction, the technology to achieve it, and the cost guidance.

Process flow diagram showing a cooling tower blowdown treatment process
Figure 1: Process Flow Diagram (PFD) Showing Successive Recovery Additions

Table 2: Cooling Tower Blowdown Successive Recovery Increases

State Point Volume Reduction Recovery Technology Cost Guide: OpEx + CapEx

A

5X

80%

RO-I with anti-scalants, concentration polarization management, and flushes

$1–2 /m3

B

10X

90%

Above + high pH, UF & RO-II

$2–3 /m3

C

20X

95%

Above + some soda ash

$3–3.5 /m3

D

40X

97.5%

Above + more soda ash

$3.5–5.8 /m3

E

70X

99%

Above + UHP-RO

$4–8 /m3

Pilot Results and Knowing What Recovery to Target and When to Stop

This pilot study and others like it provide cost and performance data for a broad range of process configurations and recoveries. Varying the quantity of soda ash (sodium bicarbonate) alone provided a lot of flexibility in achieving the desired recovery. It is generally advisable to stay below 80% calcium sulfate saturation in the brine to prevent irreversible scaling. Adding soda ash can increase recovery but is typically a costly approach and should therefore be controlled carefully. Saltworks has technologies available to help with keeping chemical consumption costs down.


Besides flexibility with process steps, the proper integration of pilot plant elements is also important for this kind of study. Although each step can be viewed as a unit operation, properly assessing the performance of a treatment chain requires considering an integrated plant with unified process controls. This is recommended for the following critical reasons:

  1. As feedwater chemistry and flow rates change upstream, an integrated plant better reacts and adjusts each unit operation accordingly, for example by using real-time sensors and controls to adjust chemical dosing.
  2. Performance monitoring algorithms can be applied. This is done at both the plant and unit operation level, whereby upstream and downstream systems communicate their performance and status to one another. Adjustments can then be made to achieve the best overall system efficiency. A unified dashboard helps plant operators and owners to monitor performance.
  3. Cohesion of process control design methods, control system components, and documentation for both capital cost and operational cost efficiency (e.g. spares and maintenance) can be ensured.

Economic Guidance

Readers are offered the following reminders and guidance when considering CTB and brine treatment economics:

  • Sum the costs of chemical treatment and secondary RO, since the secondary RO requires chemical treatment. For example, the net cost of a secondary RO may be $8/m3 ($4/m3 chemical treatment + $4/m3 RO).
  • Thermal system costs are typically >$20/m3, so although the advanced membrane brine system costs may seem high compared to potable water RO, these costs are still much lower than thermal brine concentration.
  • Know where to stop: For example, if a brine disposal outlet is available for $5/m3, a primary RO system may offer economic advantages for concentrating brine, while a secondary RO may not.
  • Capacity matters: For smaller capacity plants, adding unit operations adds process and operational complexities. For example, if the brine flow rate from the primary RO is 100 m3/day and a thermal system is economic (e.g. disposal costs >$10/m3), it may make more sense to skip the secondary RO and proceed directly to the thermal system. This is especially true if chemical treatment is avoided by using a SaltMaker evaporator crystallizer that does not require upstream pre-treatment. At higher brine flow rates, such as 500 m3/day, a secondary membrane concentrator can be highly cost advantageous.
  • Simple bench or pilot tests considerably de-risk investments and offer pay back periods of weeks to months by enabling economic and process optimization of the overall system.

Project owners do not need to become experts in advanced brine treatment or economic optimization. Contact Saltworks for help and guidance on completing these calculations.

About Saltworks

Saltworks Technologies is a leader in the development and delivery of solutions for industrial wastewater treatment and lithium refining. By working with customers to understand their unique challenges and focusing on continuous innovation, Saltworks’ solutions provide best-in-class performance and reliability. From its headquarters in Richmond, BC, Canada, Saltworks’ team designs, builds, and operates full-scale plants, and offers comprehensive onsite and offsite testing services with its fleet of mobile pilots.

Related Resources

Cooling Tower Blowdown
Application

Cooling Tower Blowdown

Saltworks can solve your cooling tower blowdown challenges. We can add novel sensors and controls to your cooling tower to minimize water consumption and blowdown production. We can treat blowdown for re-use at your cost-optimized freshwater recovery or achieve zero liquid discharge.

Photo of a ScaleSense real-time sensor/analyzer for scaling ions
Article

Real-Time Sensing and Process Control: Introducing ScaleSense

Real-time measurement provides prompt feedback for controls. A real-time sensor can help to optimize your process, reduce risk, and minimize operational and maintenance demand. Saltworks has developed a new real-time sensor—that is simple and robust—to operate in the high-TDS range.

Photo of cooling fans in a data centre
Application

Data Centre Cooling

Saltworks delivers reliable solutions for data center cooling that maximize uptime and energy efficiency while helping meet water sustainability goals. Our modular, low footprint systems can optimize cooling cycles, reduce scaling, and minimize wastewater disposal volumes.